Data analysis and reporting
Data is rarely the problem; the time to combine and read it is. We build dashboards and reports that update themselves, with AI explaining what changed and why.
Delivered by Belownil®, a design and technology studio in Lithuania working with businesses across Europe.
Who it is for
- Managers making decisions from data in several systems
- Sales and marketing teams tracking results
- Companies with a lot of operational data (manufacturing, logistics, trade)
What is included
What you get
Data consolidation
Accounting, CRM, online store, ad platforms, analytics, into one data source.
Dashboards
Clear metrics, filters and trends in Looker Studio, Power BI or a custom dashboard.
AI insights
Anomaly detection, forecasts and plain-language explanations: what changed and why.
Automatic reports
Weekly or monthly reports by email or message, without manual preparation.
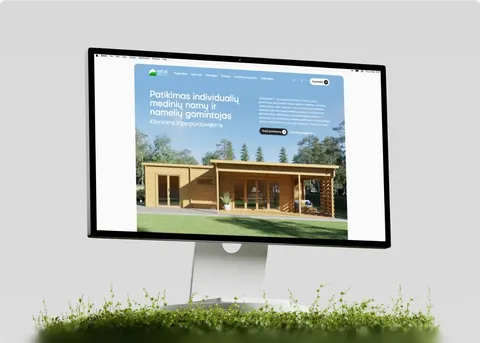
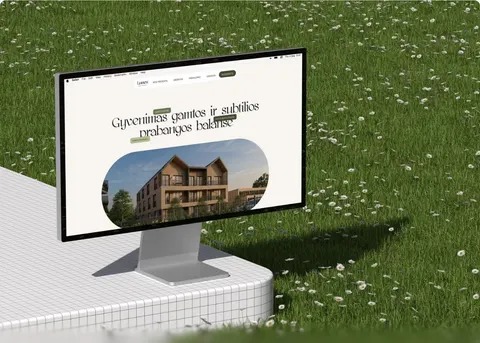
Portfolio
Projects where we did this



How we work
Project flow
Questions
Which decisions you want to make and which metrics you need for them.
Data and dashboard
Connecting sources, cleaning data, first dashboards.
Insights
AI explanations, forecasts, automatic reports.
FAQ