
Largest Contentful Paint (LCP) is one of the Core Web Vitals, measuring how quickly a website loads from a visitor’s perspective. It shows how much time passes from opening the page until the largest content element appears. If your site loads slowly, that is bad for user experience and can also cause your website to rank lower in Google Search.
When trying to solve LCP issues, it is not always clear what to focus on. Is the server too slow? Are the images too large? Is the content not rendering? Recently, Google has worked to solve this by introducing LCP subparts, which show where page-loading delays come from. They also added this data to the Chrome User Experience Report (CrUX), allowing you to see what causes delays for real visitors to your website!
Let’s look at what LCP subparts are, what they mean for your site speed, and how you can measure them.
The four LCP subparts
LCP subparts split the Largest Contentful Paint metric into four different parts:
- Time to First Byte (TTFB): How quickly the server responds to the document request.
- Resource load delay: The time spent before the LCP image starts downloading.
- Resource load time: The time spent downloading the LCP image.
- Element render delay: The time until the LCP element is rendered.
Resource timing measurements apply only if the largest page element is an image or background image. For text elements, the load delay and load time components are always zero.
How do you measure LCP subparts?
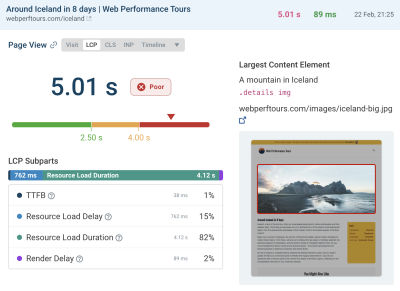
One way to measure how much each component contributes to the LCP score on your website is to use the DebugBear website speed test. Expand the Largest Contentful Paint metric to see the subparts and other details related to your LCP score.
Here we can see that TTFB and the image load duration together make up 78% of the total LCP score. This tells us that these two components are the most effective places to start optimizing.

What is happening during each of these stages? A network request waterfall visualization can help us understand which resources are loaded during each stage.
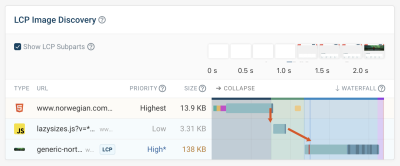
The “LCP image discovery” view filters the waterfall visualization, leaving only the resources that are relevant to Largest Contentful Paint. In this case, each of the first three stages includes one request, and the last stage ends quickly without loading any new resources. However, this depends on your specific website and will not always be the case.
Time to First Byte (TTFB)
The first step toward rendering the largest page element is receiving the document HTML. We recently published an article about improving the TTFB metric.
In this example, we can see that establishing the server connection does not take long. Most of the time is spent waiting for the server to generate the page HTML. So, to improve TTFB, we need to speed up this process or cache the HTML so that we can skip HTML generation completely.
Resource load delay
The “resource” we want to load is the LCP image. Ideally, we simply have an <img> tag close to the top of the HTML, and the browser finds it immediately and starts loading it.
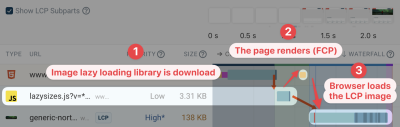
But sometimes we run into a load delay, as in this case. Instead of directly loading the image, the website uses lazysize.js, an image lazy-loading library that loads the LCP image only when it determines that the image will appear in the viewport.
Part of the load delay comes from needing to download that JavaScript library. But the browser also has to finish the page layout and start rendering content before the library knows that the image is in the viewport. After the request is complete, a CPU task runs (orange), leading to the First Contentful Paint stage, when the page begins rendering. Only then does the library initiate the LCP image request.
How can this be optimized? First, instead of a lazy-loading library, you can use the built-in loading="lazy" image attribute. That way, image loading will no longer depend on the initial JavaScript code loading.
Most importantly, however, the LCP image should not be lazy-loaded. That way, the browser can start loading it as soon as the HTML is ready. According to Google, you should aim to completely remove the resource load delay.
Resource load duration
The load duration subpart is probably the most straightforward: before rendering the LCP image, you have to download it!
In this example, the image is loaded from the same domain as the HTML. That is good because the browser does not need to connect to a new server.
Other methods you can use to reduce load delay:
- Use a modern image format that provides better compression.
- Load images at a size that matches the size at which they are displayed.
- Lower the priority of other resources that may compete with the LCP image.
Element render delay
The fourth and final LCP component, render delay, is often the most confusing. The resource is already loaded, but for some reason the browser is not yet ready to show it to the user!
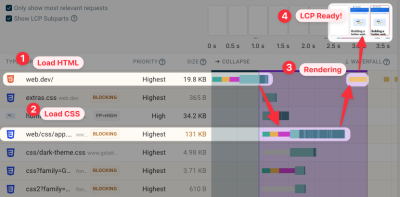
Fortunately, in the example we have looked at so far, the LCP image appears quickly after it is loaded. One common cause of render delay is when the LCP element is not an image. In that case, render delay is caused by render-blocking scripts and stylesheets. Text can appear only after these have loaded and the browser has completed the rendering process.
Another reason you may see render delay is when a website preloads the LCP image. Preloading is a good idea because it practically removes any load delay and ensures that the image is loaded early.
However, if the image finishes downloading before the page is ready to render, you will see increased render delay. And that is fine! You have improved the overall site speed, but by optimizing the image, you have discovered a new bottleneck to focus on.

LCP subparts in real-user CrUX data
Analyzing Largest Contentful Paint subparts with lab tests can provide many insights into where you can optimize. But too often, LCP in the lab does not match what happens for real users!
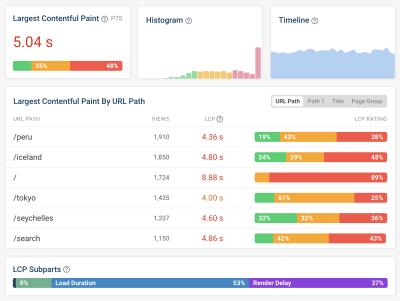
That is why, in February 2025, Google began including subpart data in the CrUX data report. These metrics are not included in PageSpeed Insights (yet?), but you can see them in DebugBear’s Web Vitals tab.

One especially useful piece of information here is the LCP resource type: it shows how many visitors saw the LCP element as a text element or an image.
Even on the same page, different visitors will see slightly different content. For example, different elements are visible depending on device size, or some visitors will see a cookie banner while others will see the actual page content.
To make the data easier to interpret, Google provides subpart data only for images.
If the LCP element is usually text on the page, subpart information will not be very useful, because it will not apply to most of your visitors.
However, analyzing text-based LCP is fairly simple: everything that is not part of the TTFB score is render delay.
Track subparts on your website with Real User Monitoring (RUM)
Lab data does not always match what real users experience. CrUX data is high-level, is provided only for high-traffic pages, and takes at least 4 weeks to fully update after a change is deployed.
That is why a Real User Monitoring (RUM) tool such as DebugBear is useful for fixing LCP scores. You can track scores across all pages of your website over time and get dedicated dashboards for each LCP subpart.
You can also review specific visitor experiences, see what their LCP image was, examine the request waterfall, and check LCP subpart timings. Sign up for a free trial.
Conclusion
The availability of more detailed Largest Contentful Paint metric data gives web developers a major advantage when trying to speed up their websites.
Adding subparts to CrUX provides new insights into how real visitors experience your website and can tell you whether the optimizations you are considering would actually be impactful.


.webp)
.webp)
.webp)
.webp)
.webp)